Executive summary
A stablecoin transfer can be cheap on-chain and still be expensive as a delivered payment. A corridor only breaks even when the full delivered-fiat cost of the stablecoin route is no higher than the cost of a comparator performing the same task, for the same amount, timing convention and recipient outcome.
The decision variable is therefore not “gas versus wire fee.” It is fixed corridor cost plus per-payment operating cost, issuer or venue fees, FX, market basis, spread, slippage, gas, funding or prefunding, failed-payment burden, local payout and reconciliation.
The Federal Reserve’s March 2026 cross-border stablecoin note makes the same economic distinction. Its stylized U.S.–Mexico example shows how a stablecoin may shorten the intermediary chain, while also noting that on-ramp and off-ramp costs can be materially greater than the on-chain transfer cost and that the Mexican side still needs a counterparty for conversion into MXN.
Public fee schedules already show why volume matters. Tether currently publishes a USD 100,000 minimum acquisition/redemption amount and a redemption fee equal to the greater of USD 1,000 or 0.1%. The fee floor alone is therefore 100 bps at USD 100,000, 40 bps at USD 250,000, 20 bps at USD 500,000 and 10 bps from USD 1 million upward, before verification, banking, FX, slippage or payout costs.
This review does not claim a live market break-even point for an institutional U.S.–Mexico corridor. A complete, public, apples-to-apples B2B tariff for every leg of both routes was not identified. The worked example is deliberately synthetic and exists to show how the break-even surface behaves.
Define “delivered” before comparing routes
For this review, a payment is delivered only when the agreed net MXN is usable in the recipient’s destination bank account. A stablecoin arriving in a wallet is an intermediate state, not the same product.
| Field | Stablecoin route | Comparator route |
|---|---|---|
| Sender funding | USD available to treasury | USD available to treasury |
| Recipient outcome | Net MXN available in bank account | Net MXN available in bank account |
| Denominator | Delivered payments | Delivered payments |
| Time convention | Quote/instruction to usable funds | Instruction to usable funds |
| FX | Executable USD/MXN conversion | Executable USD/MXN conversion |
| Failures | Rejects, review, returns and rework included | Same treatment |
| Funding | Incremental locked balance and hold days | Same convention |
If any of these fields changes between the two routes, the result is no longer a break-even comparison.
The break-even model
For route r:
C_r(N) = F_r + N[c_r + a × b_r / 10,000]
where F_r is fixed period cost,
c_r is fixed cost per delivered payment,
b_r is variable cost in basis points,
a is average delivered ticket and
V = a × N is delivered volume.
The per-payment advantage of the stablecoin route is:
Δu = (c_b - c_s) + a × (b_b - b_s) / 10,000
If the stablecoin route has the higher fixed cost and
Δu > 0, continuous break-even is:
N* = (F_s - F_b) / Δu
V* = a × N*
Production analysis should test both integer neighbours around
N*. If the per-payment advantage is non-positive while the
stablecoin route also has higher fixed cost, there is no positive-volume
crossing under that parameter set.
The more useful treasury equation solves for exit cost directly:
          b_exit,max =
          b_b - b_s,non-exit
          + 10,000(c_b-c_s)/a
          + 10,000(F_b-F_s)/V
A live route passes the cost gate only when the all-in executable exit cost is below this ceiling, after any internal safety buffer.
Funding cost should remain a separate field:
C_fund = V_locked × annual_rate × hold_days / day_count
At a 5% annual funding rate, one incremental locked day is about 1.37 bps; three days are about 4.11 bps.
If a provider contract has a minimum spend, the model becomes piecewise:
C_s = F_integration + max(M, usage_cost(V,N))
Worked example: synthetic, not a provider quote
| Input | Comparator | Stablecoin route |
|---|---|---|
| Monthly fixed cost | $500 | $2,000 |
| Per delivered payment | $8 | $4 |
| Variable / non-exit variable cost | 35 bps | 6 bps |
| Exit cost | Included | Scenario variable |
| Average ticket | $10,000 | $10,000 |
At USD 1 million per month there are 100 delivered payments. Comparator cost is:
500 + 100×8 + 1,000,000×35/10,000 = $4,800
At 10 bps exit, stablecoin cost is:
2,000 + 100×4 + 1,000,000×(6+10)/10,000 = $4,000
The modeled difference is USD 800 in favour of the stablecoin route. At 20 bps exit the stablecoin cost becomes USD 5,000 and loses by USD 200. The exact exit ceiling at this volume is therefore 18 bps.
| Monthly delivered volume | Maximum exit cost for parity |
|---|---|
| $250k | Negative / no positive exit budget |
| $500k | 3 bps |
| $1m | 18 bps |
| $2m | 25.5 bps |
| $5m | 30 bps |
| $10m | 31.5 bps |
Higher volume absorbs fixed cost, but it cannot rescue a route whose variable exit cost is structurally above the long-run variable-cost gap.
Public fee schedules: why the cost curve is nonlinear
Public schedules should be used as components of a corridor model, not as proof of an end-to-end delivered cost.
| Path | Public evidence | Break-even implication |
|---|---|---|
| USDC / Circle Mint | Circle’s current Mint materials describe 1:1 issuer redemption for eligible institutions. Standard bank-wire redemption may carry no Circle/banking-partner fee, but account/tier/net-flow dependent redemption adjustments can apply, and bank or third-party fees remain separate. | Primary access may remove one secondary-market trade, but bank, FX, eligibility and transfer costs still need to be priced. |
| USDT / Tether primary | Minimum $100k; redemption fee is max($1,000, 0.1%); a separate verification fee is published. | Fee floor dominates smaller primary redemptions. |
| DAI | Fiat delivery normally requires a market/PSM-linked conversion plus a subsequent fiat exit. | Do not treat a stable-to-stable swap as completion. |
| BUSD | New minting stopped and major exchange support was wound down. | Operational availability, not nominal peg, became the binding variable. |
| Kraken stablecoin/FX | Public tiered fee schedule changes with qualifying volume. | Account tier changes the same trade’s break-even result. |
| 0x / DEX aggregation | API pricing and quote data expose fixed/API fees, gas and route-specific execution components. | Price impact must be measured at the actual notional; a DEX swap is still not a fiat payout. |
| OTC / RFQ | Execution economics may be embedded in the all-in quote. | Normalize the quote against a reference mid instead of looking only for a separate “fee” line. |
Tether primary-redemption fee-floor example
| Redemption amount | Published fee formula result | Effective bps before other costs |
|---|---|---|
| $100k | $1,000 | 100 bps |
| $250k | $1,000 | 40 bps |
| $500k | $1,000 | 20 bps |
| $1m | $1,000 | 10 bps |
| $5m | $5,000 | 10 bps |
This does not establish the cost of a complete USDT corridor. It isolates one published component to show why minimum fees create a nonlinear volume threshold.
Empirical cases: what can break first
The strict review window is 26 September 2023 through 26 September 2026. Three within-window cases below show operational exit risk. Two earlier cases are retained only as numerical stress references and should not be interpreted as evidence of recent event frequency.
| Event | Observed data | Exit / slippage implication | Time |
|---|---|---|---|
| BUSD / Binance wind-down | Exchange notice did not publish affected notional. Earlier issuer context recorded $7.9bn of redemptions in the first 32 days after the mint halt. | Specified BUSD→FDUSD path was 1:1 with zero conversion/trading fees, while broader product and withdrawal support was sunset. | Nov 2023–Jan 2024 |
| EEA USDT/DAI venue restrictions | Notional not disclosed in the venue notice. | Spot trading pairs were removed for EEA users; residual balances could still be sold through Convert. Universal executed spread was not published. | Announced 3 Mar 2025; effective 31 Mar 2025 |
| Kraken TUSD delisting | Notice described some affected markets as limited or inactive; exact TUSD notional was not disclosed. | The venue warned that residual liquidation under insufficient liquidity could occur materially below recent reference prices. | Dec 2025–Mar 2026 |
| DAI PSM emergency fee — pre-window calibration | Governance parameter event rather than corridor volume. | PSM-USDC-A fee-in moved from 0% to 1%, a 100 bps parameter shock, before later normalization. | Mar 2023 |
| USDT Curve 3pool — pre-window calibration | Pool reached roughly 75% USDT in the cited market update. | USDT traded around $0.996, approximately 40 bps below par; imbalance indicated one-sided exit pressure. | Jun 2023 |
Missing does not mean zero. Public incident notices often omit executed institutional slippage, RFQ notional, account tier and full local-payout economics. Those fields belong in a missing-data register until a quote or fill proves them.
Treasury controls: thresholds, hedging and execution
Cost gate. Recompute the exit-cost ceiling from live period volume, ticket mix and contract costs. Subtract the desk’s internal safety buffer. Reject or reroute the transaction when the executable all-in exit quote exceeds it.
Liquidity gate. Compare intended order size against executable depth inside the approved price-impact band. A top-of-book spread is not sufficient.
Time gate. Translate every incremental locked day into basis points. If the remaining cost headroom is h bps:
d_max = h / (annual_rate × 10,000 / day_count)
At a 5% annual funding rate, 5 bps of remaining headroom is consumed in roughly 3.65 incremental days.
Eligibility gate. Check current deposit, withdrawal, redemption, trading, account, jurisdiction and local-payout availability before each production window. A transferable token is not automatically an executable corridor.
Failure gate. Track cost per delivered payment. Rejections, manual review, returned payouts and support activity should not disappear from the denominator.
Hedging. Where mandate and policy permit, desks can evaluate firm FX quotes, align stablecoin sale with local-currency conversion, reduce open inventory time and evaluate approved forwards or NDFs for predictable exposures. Hedge cost belongs in the same corridor model.
Execution. Compare RFQ with order-book or DEX execution at the intended notional. Split orders only after adding repeated gas and fixed costs. Capture quote, reference mid, explicit fees, implied spread, minimum receive, realized fill, payout time and exceptions.
Visuals: volume, exit cost and the parity surface
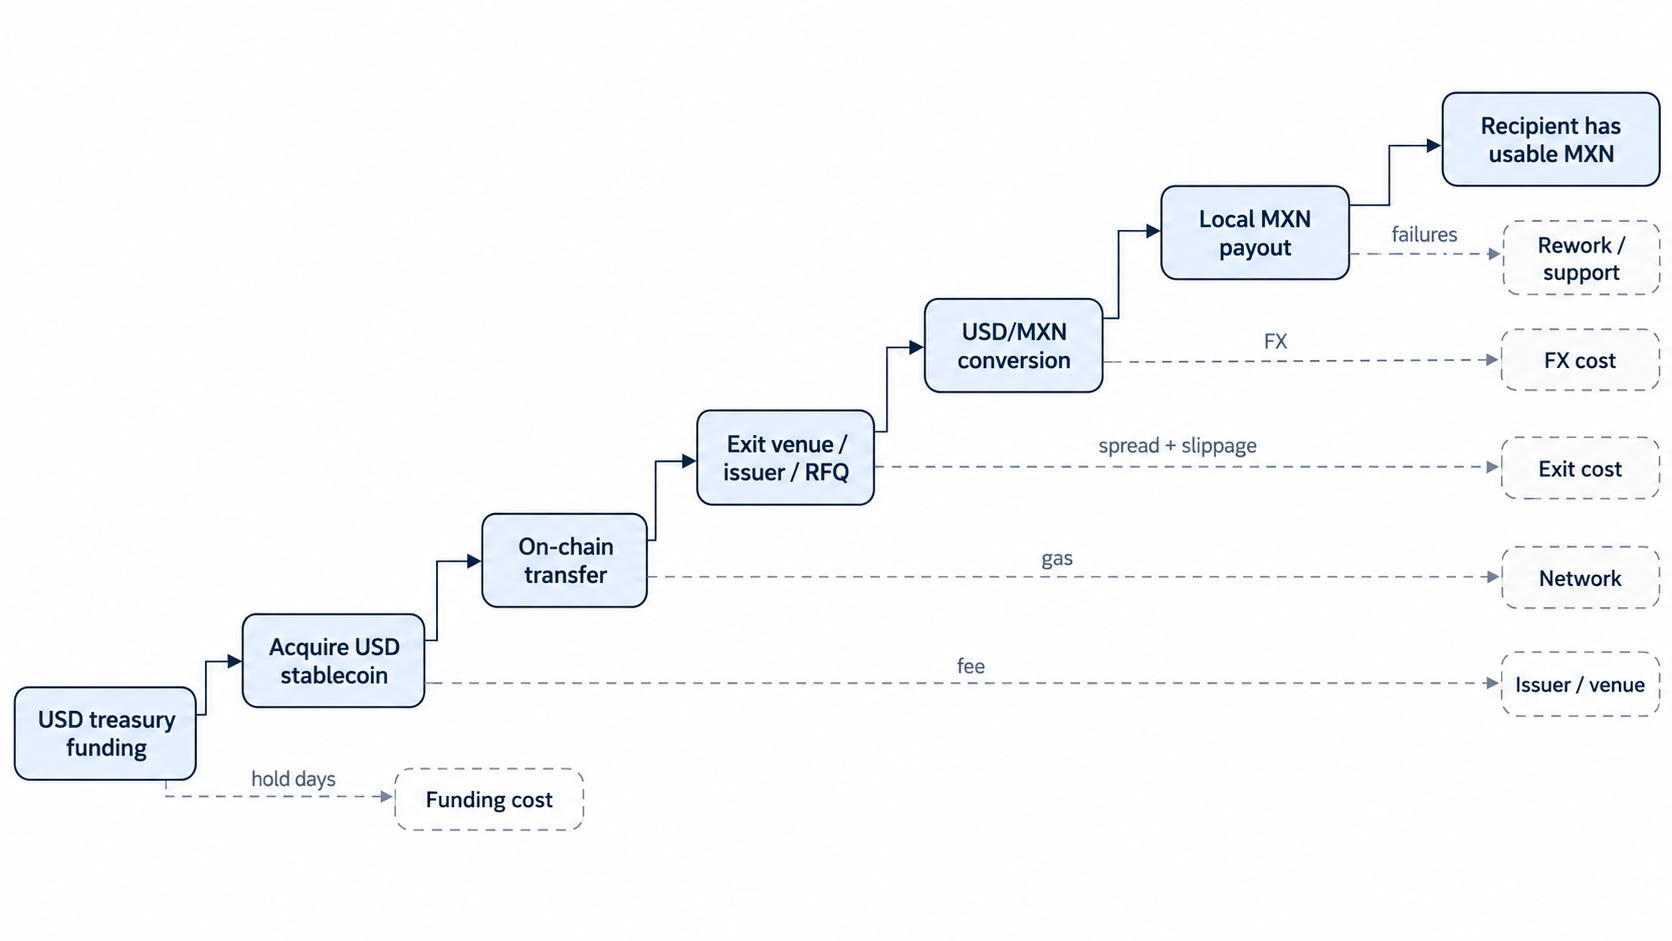
The decision rule
A stablecoin corridor breaks even only when three conditions hold at once:
- both routes perform the same delivered task;
- live or contract-backed inputs put the stablecoin route at or below cost parity at the expected volume;
- the route remains executable inside the treasury’s liquidity, eligibility, timing and failure thresholds.
The corridor should therefore be reviewed as a cost surface, not a slogan. Volume moves the surface. Exit cost tilts it. Ticket mix, tariff tiers, hold time and failed payments move it again.
The correct treasury question is not: “Are stablecoins cheaper?”
It is: “At this period’s delivered volume, what is the maximum exit cost we can tolerate, and can we prove that we can execute below it?”
Sources and methodology notes
- Federal Reserve Board — Payment Stablecoins and Cross Border Payments
- Tether fee schedule
- Circle USDC Terms
- Kraken fee schedule
- 0x pricing
- 0x — Understanding Bridging Costs
- Binance — BUSD removal and conversion notice
- Binance — EEA non-MiCA stablecoin restrictions
- Kraken — scheduled asset delistings, December 2025
- Paxos — BUSD redemption update
- Maker Governance — Emergency Parameter Changes, 11 March 2023
- Maker Governance — PSM Parameter Normalization, 29 March 2023
- Kaiko — Q2 Crypto Liquidity Update
Use the companion review-file template to replace every synthetic input with contract, account-tier and executable-quote evidence before making a corridor decision.